s06: EEG magic
Contents
s06: EEG magic#
from pathlib import Path
import scipy.io as sio
from scipy.stats import pearsonr, ttest_rel
import matplotlib.pyplot as plt
from matplotlib.collections import LineCollection
import pandas as pd

import numpy as np
import seaborn as sns

plt.rcParams.update({"figure.dpi": 200,"figure.facecolor":"w","figure.figsize": (15,10)})
dir_script = Path("__file__").parent.absolute()
dir_rawdata = Path.joinpath(dir_script, "files")
fname = 'tutorial1-01.mat'
data = sio.loadmat(Path.joinpath(dir_rawdata,fname))
data_mne = np.vstack((data['EEG'],data['labels']))
data['EEG']
data['labels']
array([[0, 0, 0, ..., 0, 0, 0]], dtype=uint8)
data['EEG'].shape
(7, 288349)
print('EEG dimensions:', data['EEG'].shape)
print('Label dimensions:', data['labels'].shape)
print(np.unique(data['labels']))
EEG dimensions: (7, 288349)
Label dimensions: (1, 288349)
[0 1 2 3 4 5 6 7 8 9]
Set config vars for MNE#
To process the data we have to hardcode a couple of information to pass to the MNE toolbox. For now these are channel names and types of our data, as well as the sampling rate.
# convert raw numpy to mne
n_channels = data['EEG'].shape[0]+1
ch_types = ['eeg'] * n_channels
ch_types[-1] = 'stim'
ch_nms = ['Fz', 'Cz', 'Pz', 'CP1', 'CP3', 'C3', 'C4','status']
srate = 2048

info = mne.create_info(ch_names=ch_nms, sfreq=srate, ch_types=ch_types)
---------------------------------------------------------------------------
NameError                                 Traceback (most recent call last)
Input In [6], in <cell line: 8>()
      5 ch_nms = ['Fz', 'Cz', 'Pz', 'CP1', 'CP3', 'C3', 'C4','status']
      6 srate = 2048
----> 8 info = mne.create_info(ch_names=ch_nms, sfreq=srate, ch_types=ch_types)

NameError: name 'mne' is not defined
Create MNE object#
With the raw data loaded and the config variables defined, we can initiate the MNE object.
raw = mne.io.RawArray(data_mne, info);
Creating RawArray with float64 data, n_channels=8, n_times=288349
    Range : 0 ... 288348 =      0.000 ...   140.795 secs
Ready.
WOW, that was super easy (when you know the right functions XD). Lets, already do some basic processing of the data.
raw.filter(0.5, 20);
Filtering raw data in 1 contiguous segment
Setting up band-pass filter from 0.5 - 20 Hz

FIR filter parameters
---------------------
Designing a one-pass, zero-phase, non-causal bandpass filter:
- Windowed time-domain design (firwin) method
- Hamming window with 0.0194 passband ripple and 53 dB stopband attenuation
- Lower passband edge: 0.50
- Lower transition bandwidth: 0.50 Hz (-6 dB cutoff frequency: 0.25 Hz)
- Upper passband edge: 20.00 Hz
- Upper transition bandwidth: 5.00 Hz (-6 dB cutoff frequency: 22.50 Hz)
- Filter length: 13517 samples (6.600 sec)
[Parallel(n_jobs=1)]: Using backend SequentialBackend with 1 concurrent workers.
[Parallel(n_jobs=1)]: Done   1 out of   1 | elapsed:    0.0s remaining:    0.0s
[Parallel(n_jobs=1)]: Done   2 out of   2 | elapsed:    0.0s remaining:    0.0s
[Parallel(n_jobs=1)]: Done   3 out of   3 | elapsed:    0.0s remaining:    0.0s
[Parallel(n_jobs=1)]: Done   4 out of   4 | elapsed:    0.0s remaining:    0.0s
[Parallel(n_jobs=1)]: Done   7 out of   7 | elapsed:    0.0s finished
#store data for seminar
pd.DataFrame(data['EEG']).to_csv(r'./files/eeg_raw.csv', index=False)
pd.DataFrame(data['labels']).to_csv(r'./files/eeg_labels.csv', index=False)
Prepare epoching#
To better understand the data, we want to find events in the raw data and epoch around these.
url_eeg_raw = 'https://raw.githubusercontent.com/BioPsychKiel/datascience_in_practice/main/tutorials/files/eeg_raw.csv'
url_eeg_labels = 'https://raw.githubusercontent.com/BioPsychKiel/datascience_in_practice/main/tutorials/files/eeg_labels.csv'

EEG = np.array(pd.read_csv(url_eeg_raw))
labels = np.array(pd.read_csv(url_eeg_labels))
labels = labels[0]

cards = [
    'Ace of spades',
    'Jack of clubs',
    'Queen of hearts',
    'King of diamonds',
    '10 of spaces',
    '3 of clubs',
    '10 of hearts',
    '3 of diamonds',
    'King of spades',
]

onsets = np.flatnonzero(labels)
print(onsets[:10])  # Print the first 10 onsets
print('Number of onsets:', len(onsets))
[ 7789  8790  9814 10838 11862 12886 13910 14934 15958 16982]
Number of onsets: 270
classes = labels[onsets]
print('Card shown at each onset:', classes[:10])
Card shown at each onset: [3 6 7 9 1 8 5 2 4 9]
Now lets do the epoching
nchannels = 7 # 7 EEG channels
sample_rate = 2048. # The sample rate of the EEG recording device was 2048Hz
nsamples = int(1.0 * sample_rate) # one second's worth of data samples
ntrials = len(onsets)

trials = np.zeros((ntrials, nchannels, nsamples))
for i, onset in enumerate(onsets):
    trials[i, :, :] = EEG[:, onset:onset + nsamples]

print(trials.shape)
(270, 7, 2048)
Defining a function#
Because we will probably plot our data a trazillion times, lets define a function to make the code look cleaner.
def plot_eeg(EEG, vspace=100, color='k'):
    '''
    Plot the EEG data, stacking the channels horizontally on top of each other.

    Parameters
    ----------
    EEG : array (channels x samples)
        The EEG data
    vspace : float (default 100)
        Amount of vertical space to put between the channels
    color : string (default 'k')
        Color to draw the EEG in
    '''

    bases = vspace * np.arange(7) # vspace * 0, vspace * 1, vspace * 2, ..., vspace * 6

    # To add the bases (a vector of length 7) to the EEG (a 2-D Matrix), we don't use
    # loops, but rely on a NumPy feature called broadcasting:
    # http://docs.scipy.org/doc/numpy/user/basics.broadcasting.html
    EEG = EEG.T + bases

    # Calculate a timeline in seconds, knowing that the sample rate of the EEG recorder was 2048 Hz.
    samplerate = 2048.
    time = np.arange(EEG.shape[0]) / samplerate

        # Plot EEG versus time
    plt.plot(time, EEG, color=color)

    # Add gridlines to the plot
    plt.grid()

    # Label the axes
    plt.xlabel('Time (s)')
    plt.ylabel(r'Channels Amplitude [$\mu$V]')

    # The y-ticks are set to the locations of the electrodes. The international 10-20 system defines
    # default names for them.
    plt.gca().yaxis.set_ticks(bases)
    plt.gca().yaxis.set_ticklabels(['Fz', 'Cz', 'Pz', 'CP1', 'CP3', 'C3', 'C4'])

    # Put a nice title on top of the plot
    plt.title('EEG data')
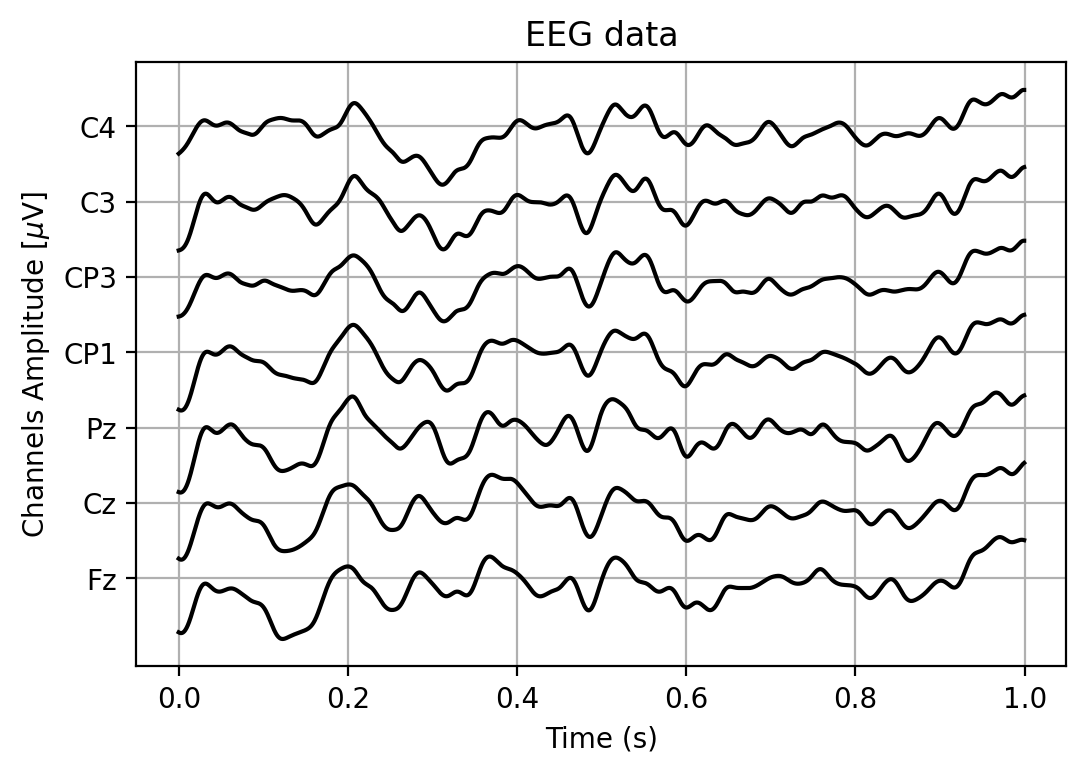
# run the function with our eeg data from one trial
idx_trial = 0
plt.figure(figsize=(6,4))
plot_eeg(trials[idx_trial, :, :], vspace=30)
More plotting#
“Why do you always plot your data?”
“Because I can” - Immanuel Kant
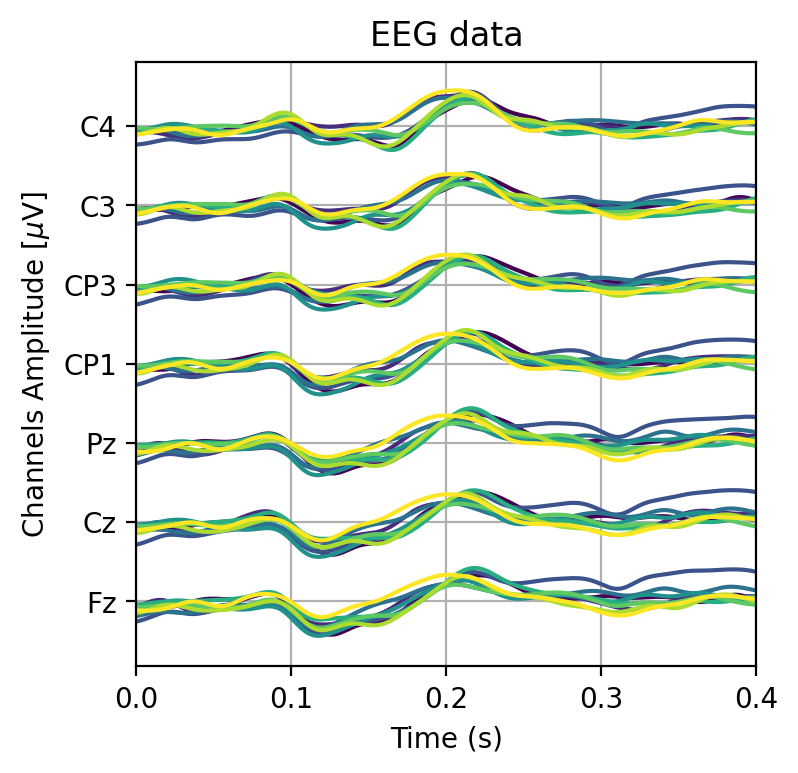
# Lets give each response a different color
cfg_colors_eeg_plot_trials = plt.cm.viridis(np.linspace(0,1,EEG.shape[0]+2))

plt.figure(figsize=(4,4))

# Plot the mean EEG response to each card, such an average is called an ERP in the literature
for i in range(len(cards)):
    # Use logical indexing to get the right trial indices
    erp = np.mean(trials[classes == i+1, :, :], axis=0)
    plot_eeg(erp, vspace=30, color=cfg_colors_eeg_plot_trials[i])
plt.xlim(0,0.4)
(0.0, 0.4)
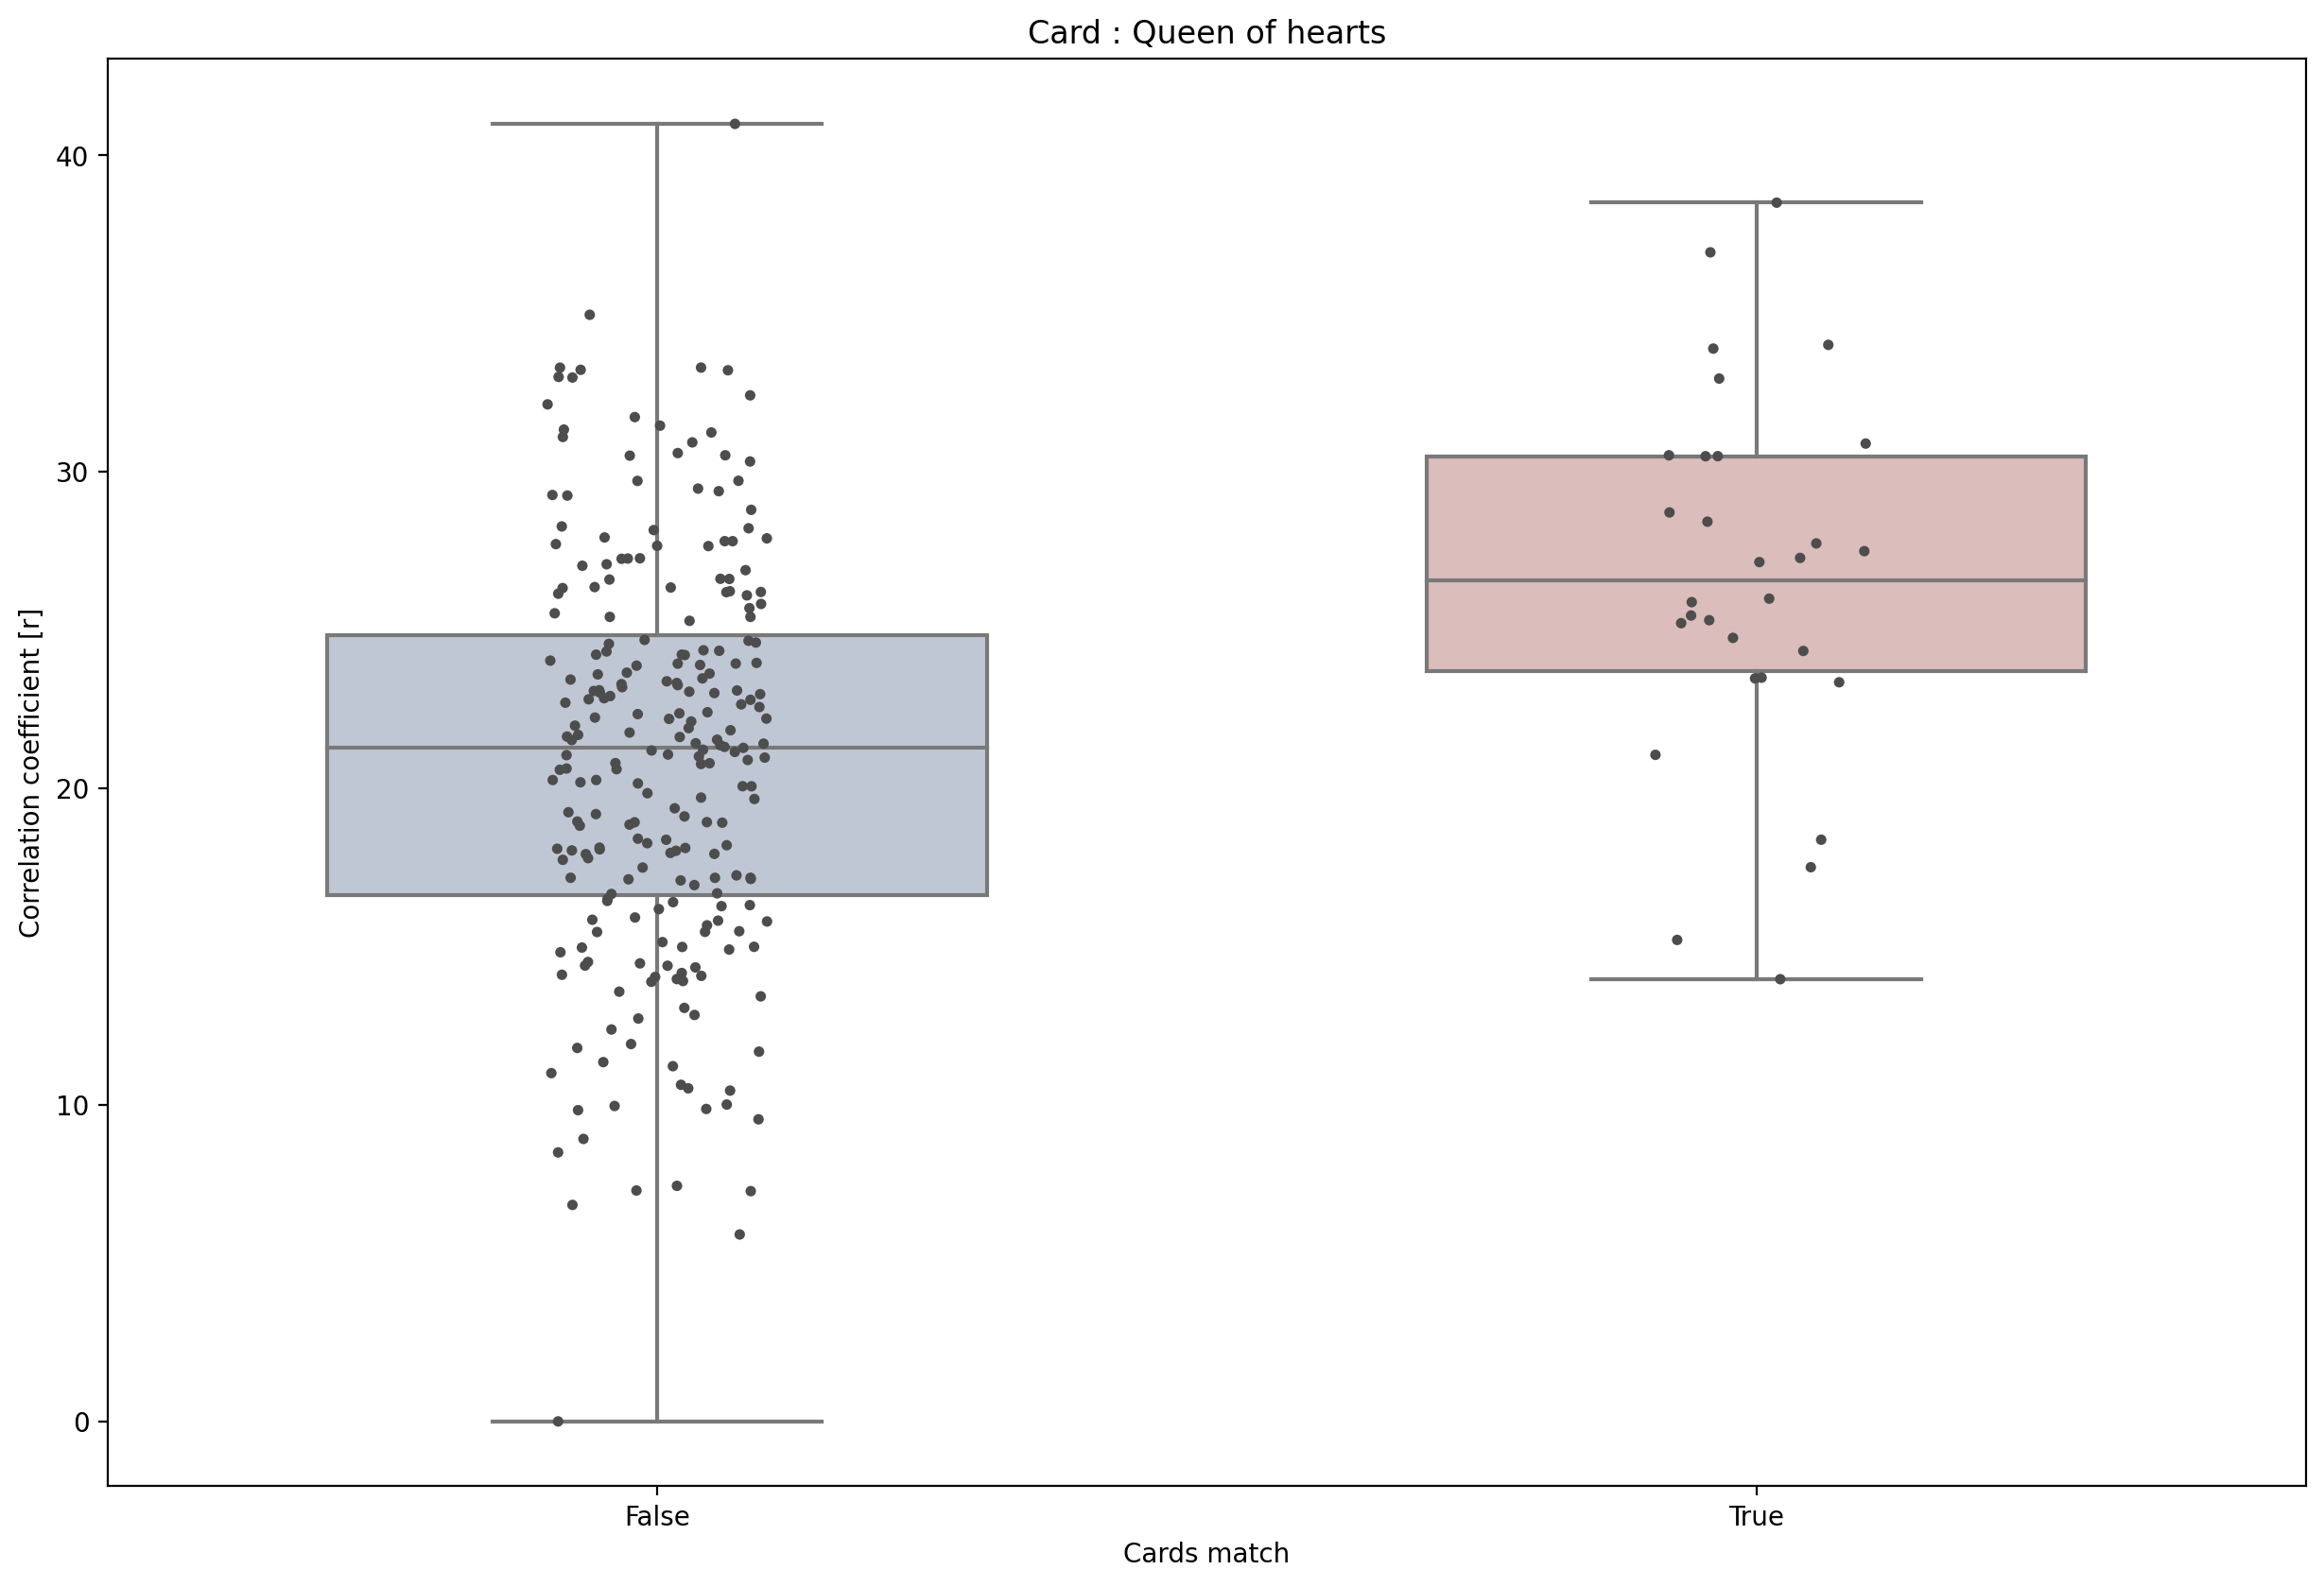
Find features#
For the classification we want to extract the P300 amplitude. Easy!
from_index = int(0.25 * sample_rate)
to_index = int(0.4 * sample_rate)
p300_amplitudes = np.mean(np.mean(trials[:, :, from_index:to_index], axis=1), axis=1)
p300_amplitudes -= min(p300_amplitudes) # Make them all positive
card_oi = 3
pearsonr(classes == card_oi, p300_amplitudes)
sns.boxplot(x=classes == card_oi,y=p300_amplitudes,whis=[0, 100], width=.6,palette="vlag")
sns.stripplot(x=classes == card_oi,y=p300_amplitudes,size=4, color=".3", linewidth=0,dodge=True)
plt.ylabel('Correlation coefficient [r]')
plt.xlabel('Cards match')
plt.title(f'Card : {cards[card_oi-1]}')
Text(0.5, 1.0, 'Card : Queen of hearts')
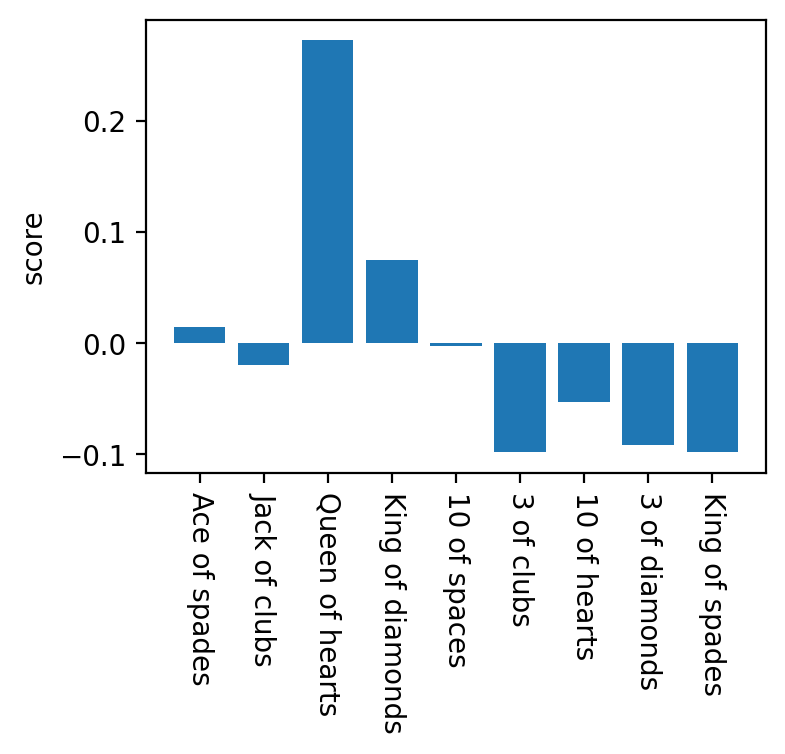
nclasses = len(cards)
scores = [pearsonr(classes == i+1, p300_amplitudes)[0] for i in range(nclasses)]

# Plot the scores
plt.figure(figsize=(4,3))
plt.bar(np.arange(nclasses)+1, scores, align='center')
plt.xticks(np.arange(nclasses)+1, cards, rotation=-90)
plt.ylabel('score')

# Pick the card with the highest score
winning_card = np.argmax(scores)
print('Was your card the %s?' % cards[winning_card])
Was your card the Queen of hearts?